Annotation may be used to show when Events have been triggered. Using the When to Draw option, you can determine when you want event triggered annotation to appear.
annotation within a chart can also be created by putting the chart annotation in edit mode and drawing a new annotation within its border. Using this method to create new annotation within a chart allows you to create text, lines, or shapes that only appear when the data is triggered. The only annotation that can be added to a chart as components to be triggered are text boxes, lines or shapes.
The following steps will walk you through creating an event trigger within a Chart annotation. During this process you may want to change other properties or settings. Do so, and then continue with the steps listed below.
1. Right click the chart and select properties from the menu.
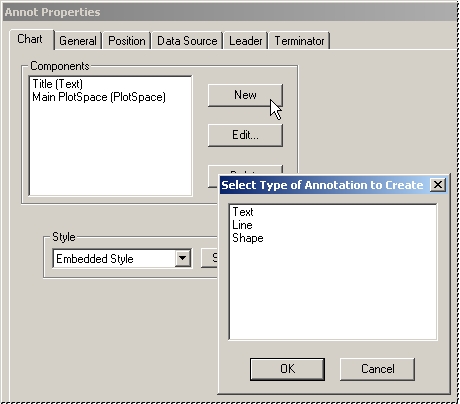
2. In the Components section of the Chart tab, create a New component.
3. Highlight the new component in the list and click the Edit button.
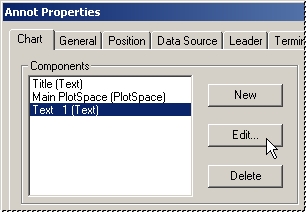
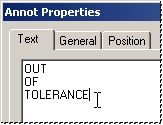
4. In the Annot Properties dialog, enter the text you want to appear when the data is triggered.
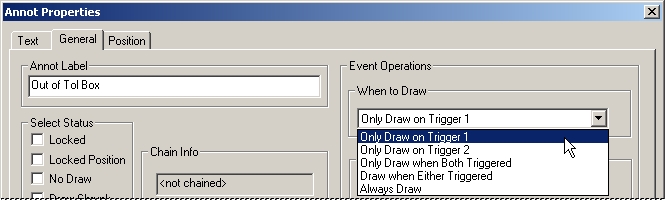
5. Next, select the General tab.
6. Select the Draw only if triggered radio button in the Event Action section of the dialog.
7. Click Ok to return to the Chart Annot Properties. Select the Data Source tab.
8. Select a DataSet for the chart annot. If you do not have one already defined, you need to create one.
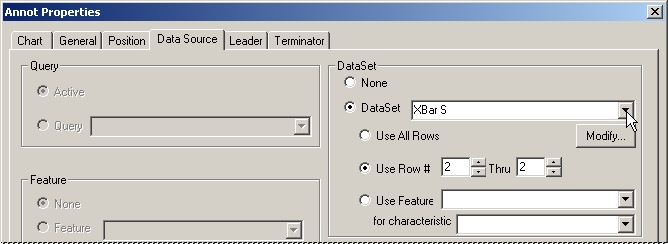
9. Click the modify button, located under the DataSet list to open the DataSet Properties dialog.
10. Select the Event tab.
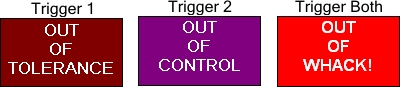
11. Select the method you will use to evaluate the samples from the Trigger 1 and Trigger 2 menu.
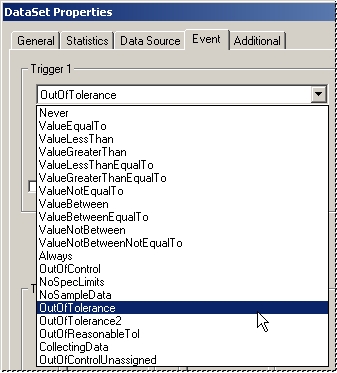
12. If the selected Trigger allows for additional values to be entered, enter the value(s) into the value box corresponding with the selection you made. This value will be used by CM4D to evaluate the samples against.
13. Click OK to close the DataSet Properties dialog, then click OK again to close the chart Annot Properties dialog.
14. Your annotation is now set up to trigger according to your event settings.
15. Repeat this step for each component you want to add to the chart.
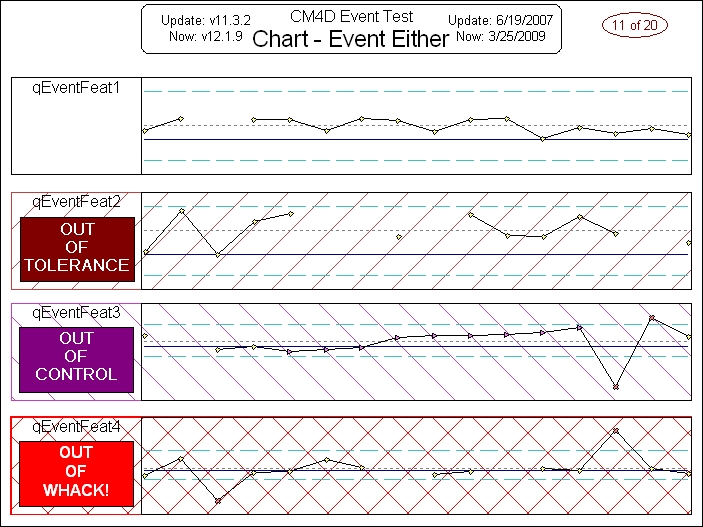
16. Below is an example of what charts with a triggered components may look like.