
Topic Contents: Hide
Annotation are objects that you place on sheets to create reports. An annotation may be added to a sheet by clicking on the button of the type of annotation you wish to create, and then clicking on its approximate position on the sheet. CM4D will place a default sized annotation block where you clicked.
· Annotation may be positioned on the sheet in any manner you choose. This can be done manually, or by using annotation positioning options. See the topic Selecting annotation for more information.
· Double-clicking on an annotation puts your annotation in edit mode, distinguished by a blue border. Right clicking on the annotation while it is in edit mode will bring up a menu with options for editing annotation.
· All annotation have properties. Annotation have common properties like general, style and position properties. Annotation also have properties that are unique to each.
· A list of all the annotation present on a sheet can be viewed by right clicking an empty space on the sheet and selecting Annot List.
§ The Sheet dialog will appear. If you would like to edit one of the annotation in the list, select it and click the Edit button.
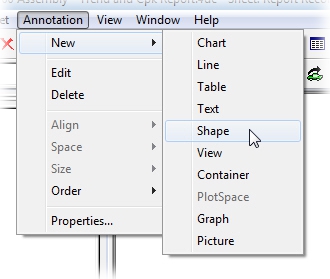
Annotation can be created two ways:
1. Annotation Menu > New
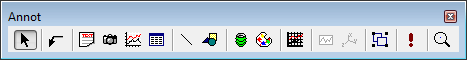
2. Annotation Toolbar Buttons
The types of annotation that can be used in a CM4D document are as follows:
Charts are very versatile instruments which allow you to display measured, designed, and statistical feature information. CM4D has three main chart types: trend charts, control charts, and feature comparison charts.

A Chart annotation can be created with the Chart ( ) tool or by selecting Annotation in the menu bar, then selecting Chart.

You must have a DataSet to use the chart annotation. If you already have a DataSet created that you want to use for this chart, you can select it by accessing the charts properties and selecting the DataSource tab within the properties dialog. Within this dialog, select the desired DataSet from the menu in the DataSet selection. Under this menu you have the option to select which row of the DataSet you want to use. The chart will then be populated with the data from just that line. If you choose not to specify a line, the chart will be populated with all of the features within the DataSet.
If you do not have a DataSet created you will need to create one. See the topic DataSet Tree for information on creating and modifying DataSets.
Containers are annotation which can hold objects such as pictures, graphics, movies, animations, or text boxes. A container is a unique item. Types of annotation which can be held in containers are bitmap image files, a Microsoft Excel document, or a variety of other types of files. In order for CM4D to display an image correctly in a Container, you must have the corresponding viewer installed on your system.
The Container annotation type will cease to be advanced, and its use will potentially limit the availability of future enhancements. Users are encouraged to use the Picture Annot in place of the Container Annot for new development, and to replace existing Container Annot with a Picture annot where convenient.
1. Select the Container button  from the sheet toolbar, or select Annotation from the menu bar, then New, then Container.
2. The mouse pointer will change to resemble the container button. Click on the sheet to create a container with the default size or click and drag to manually resize the container field.
3. The Insert Object dialog will appear:
4. Choose the type of file you wish to create or insert. The annotation you have created will go directly into the edit mode. Your menu bar will change to reflect the type of file you are inserting or creating.
Using a bitmap (BMP) file in a container annotation and then saving them as an annotation template is not recommended.
Double click within the Container border to put the annotation in edit mode. The type of application that opens will be dependent upon the type of file you are editing. When editing has been completed, save your changes and then exit the program to return to CM4D. Your changes will now appear in the edited container annotation.
Select the container annotation to be deleted and press the delete key or right click within the annotation and select the Delete option from the menu. Multiple annotation can be selected for deletion by holding the shift key and clicking the left mouse button on each annotation that you wish to delete. Then strike the delete key.
The Graph Tool ( ) creates graphs which have been set up to analyze and display your data.
To use the Graph tool to create a new Graph annotation, go to the Annotation menu and select Graph from the New menu, or click the Graph button on the toolbar. Your cursor will change to look like the Graph () tool.
1. Click and drag left mouse button across the sheet to create a graph the size you want.
2. You will then need to select the graph type you would like, and assign a DataSource to it. Both of these operations can be accomplished by right clicking on the graph and selecting Properties.
3. On the Graph tab of the Annot Properties dialog box, select the type of graph you would like from the Graph Type menu.
4. On the DataSource tab of the Annot Properties dialog box, assign a DataSource to the graph. More information about the types of DataSources each graph requires can be found in Graph Types.
5. To customize the appearance of your document, you can change the style properties.
The line annotation allows you to draw lines on a sheet.

Select the Line Tool ( ) or choose New Line from the Annotation menu, and place the mouse pointer on the sheet where you would like to start drawing a line. Click and hold the left mouse button. As you drag the mouse, you will see a line appear. When the line is to the desired length and placement, release the mouse button.
Click on the line you want to delete, then press the Delete key or right click within the line’s box area and select the Delete option from the menu. Multiple annotation can be selected for deletion by holding the shift key and clicking the left mouse button on each annotation that you wish to select.
Select the line and size or place it as desired.
The Picture annot allows you to place image files on the sheet. Picture annot may be copied and pasted between Sheets and SheetSets (including the Title Sheet).
The Picture annot is the standard for displaying picture objects in CM4D (as of v15). While Container annot are still available for use, it is highly recommended that you use the Picture annot in place of the Container annot for new development, and to replace existing Container annot with a Picture annot where convenient.
Shape annotation can be created on the sheet using the Shape tool.
1. Select the Shape Tool  and place the mouse pointer on the sheet where you would like to start drawing a shape.
2. Click and hold the left mouse button.
3. As you drag the mouse, you will see a rectangle which represents the shape appear.
4. When the rectangle is the desired size and placement, release the mouse button.
5. To choose the color and type of shape you want, right click on the rectangle, hover over either Color or Type on the menu, and select the desired options from the menus.
6. Selecting Properties... from the menu will allow you to edit the shape’s Annot Properties, such as position, DataSource, etc.
1. Select the Annotation to be deleted and press the delete key, or right click within the Annotation box and select the Delete option from the menu.
2. Multiple annotation can be selected for deletion by holding the shift key and clicking the left mouse button on each Annotation that you wish to delete.
3. Then strike the delete key.
Tables allow for the display of information organized in rows and columns. At the intersection of each table row and column is a table cell. The top most row of cells is reserved for column headings and the left most column of cells is reserved for row headings. One or more footers can be added to a row or column in a table annotation using the Show DataSet Setup Table Properties dialog. The remaining cells can be edited to display any feature information.

When certain variables used in table cells resolve to more than one value, the table will automatically expand. This means that a new row (or column) will be added beneath the original cell for each resolved value. Certain variables, however, do not use table expansion, such as ~cause,sample~.
To create a Table annotation, use the Table ( ) tool or the New part of the Annotation menu.
Select the Table Tool. Your mouse pointer will change to look like the table tool. Choose the location on the sheet where you would like your table and click there. A default sized table will appear.
Select the table and press the delete key or right click within the table’s box and select the Delete option from the menu. Multiple annotation can be selected for deletion by holding the shift key and clicking the left mouse button on each.
The Text annotation allows you to place static or dynamic text on a sheet. Static text is any words or characters you type into the text that will not change unless you edit the text annotation. Dynamic text is enclosed by starting and ending tilde characters to form a CM4D variable such as "~label~". See CM4D Variables. Text annotation are created with the Sheet Toolbar, Text Tool  button.

Select the Annotation and press the delete key or right click within the Annotation’s box and select the menu, Delete option. Multiple annotation can be selected for deletion by holding the shift key and clicking the left mouse button on each Annotation that you wish to delete. Then press the delete key.
Double click within the annotation box to edit the text directly on the sheet. While editing, the Annotation will have a blue border around its box. Clicking outside of this border will end the edit.
View annotation allow you to display selected features as Feature Markers in spatial relation to a 3D image. See the topic Images in CM4D for more information on the types of images that may be used in CM4D.
A View containing Features displayed as red Spheres superimposed on two 3D images representing the parts the Features are associated to.
More than one View annotation can be placed on a single sheet.
New View annotation are created using the View ( ) tool (or the menu Annotation > New > View). Click the button and draw a box on the page where you want the view while holding the left mouse button down. After creating a view, it needs to be edited in order to assign the image type and other various properties. Refer to the topic View Annotation for more information on loading an image into a View, or the topic View Properties.
When creating views for a CM4Di Template, the size of the view needs to be the same on each SheetSet. An easy method for ensuring that the view size is consistent throughout a SheetSet, use ReportTweak.
To edit a View, double-click inside the border, right-click and select Edit from the context menu, or use the Edit View ( ) button on the toolbar. Edit Mode allows the View to be edited continuously without resolving until you exit edit mode by clicking the Edit View button again or clicking outside of the View's border.
The options available while editing a view include editing or sorting strings and creating or loading Feature sets by right-clicking in the View and selecting the context menu options. Editing a view also allows you to change the visual perspective of a View camera using the Zoom, Orient, and Camera menu options.
Unlike wireframe images, 3D images also have the option of using the 3D toolbar to modify perspectives.
Select the Annotation and press the delete key or right click within the Annotation box and select Delete from the menu. Multiple annotation can be selected by holding the shift key and clicking the left mouse button on each Annotation you wish to delete.