Global
These settings apply to all applications.
Modify Licensing Service Endpoint
Select the Management tab.
Click Settings.
Select the Global tab.
Modify the Licensing Service endpoint as required.
The Licensing Service and Data Service must be restarted if the endpoint is modified.
If you are using a Proxy server and client applications can't connect to the licensing server using the default http connection method the licensing endpoint should be changed to use net.tcp. e.g. net.tcp://ServerIP:8001/ATSLicensingServer/
Modify Event Service Endpoint
Select the Management tab.
Click Settings.
Select the Global tab.
Modify the Event Service machine name and base port as required.
Click Test to ensure you have entered the right information.
Modify CAD Report Service Endpoint
Select the Management tab.
Click Settings.
Select the Global tab.
Modify the CAD Report Service machine name and base port as required.
Click Test to ensure you have entered the right information.
View Default Language
Select the Management tab.
Click Settings.
Select the Global tab.
The default language is displayed in the Language & Currency section.
Modify Default Currency
Select the Management tab.
Click Settings.
Select the Global tab.
Select the Default Currency from the drop-down list.
View Database Schema Version
Select the Management tab.
Click Settings.
Select the Global tab.
The database schema version is displayed as well as the date and time it was last updated.
Use Checklist Security
Select the Management tab.
Click Settings.
Select the Global tab.
Place a tick in the Use Checklist Security checkbox.
Press OK.
For further information on Checklist Security, please click here.
Enable Exception Reporting
Once enabled, exception messages are reported to the ATS Inspect Development team for analysis.
Select the Management tab.
Click Settings.
Select the Global tab.
Place a tick in the Enable Exception Reporting checkbox.
Press OK.
Cockpit
Select File Format and Maximum Size for Imported Images
When adding an image to the database (for views, users, concerns, etc.) you can specify whether they should keep their original file format or be converted into.jpg, .cmp or .png. This can save a lot of space and speed up file access if your images were orginally in a larger format such as .bmp.
Select the Management tab.
Click Settings.
Select the Cockpit tab.
Select the Max Width and Max Height for imported images.
Set the maximum file size (in bytes) for images in the Max Image File Size field.
Images larger than the maximum width and height will be reduced when imported.
Data Collection
The data collection settings control some visual and data characteristics. Some of the settings are default, but other settings are critical to Inspect's ability to receive product unit information.
Modify Magnifier
An inspector can get a magnified view of an image by clicking and holding down the mouse or pressing on the screen. Here you can specify the magnification settings for this popup window.
Select the Management tab.
Click Settings.
Select the Data Collection tab.
Select the General tab at the bottom of the window.
Modify the Width and Height fields to change the size of the magnification popup window.
Modify the Zoom Factor field to change the magnification factor for the window.
Modify the Delay field to change how long the inspector must hold down the mouse or press on the screen before the popup window appears.
Select Maximum Size for Imported Images
You can specify the maximum width and height for a captured image of a defect or repair as follows.
Select the Management tab.
Click Settings.
Select the Data Collection tab.
Select the Max Width and Max Height for captured images.
Images larger than the maximum width and height will be reduced when imported to the database.
Modify Fill Styles
These settings are available in the Defect tab (below the window).
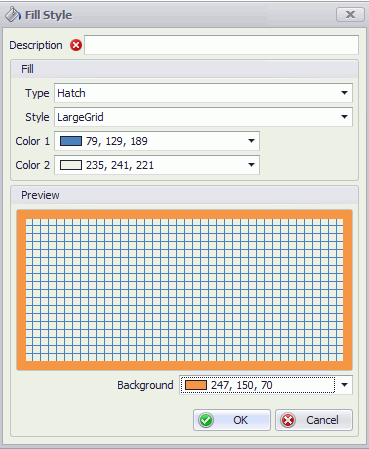
These settings configure the entered defect text box. For example, a red background is usually used to indicate that the concern is open or un-repaired and a green background usually indicates that the concern has been repaired. This helps the inspector instantly see the defect status.
Multiple styles can be stored for each status. You can then easily change style by selecting the appropriate one from the drop-down list.

Add a new fill style as follows:
Select the Management tab.
Click Settings.
Select the Data Collection tab.
Select the Defect tab at the bottom of the window.
Click the Add button (![]() ) for one of the fill styles.
) for one of the fill styles.

Enter a description for the style.
Configure the fill as required. It'll be displayed in the preview window.
Click OK.
The fill style is added.
You can edit an existing fill style by selecting it from the drop-down list and clicking the Edit button ( ).
).
Modify Pen Styles
Select the Management tab.
Click Settings.
Select the Data Collection tab.
Select the Defect tab at the bottom of the window.
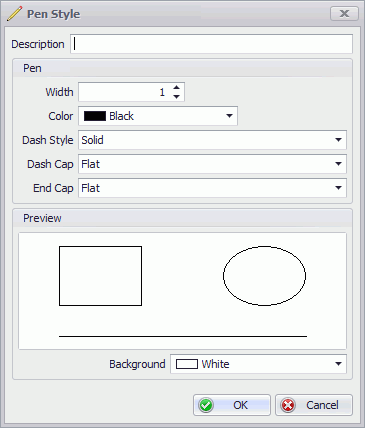
In the right-hand pane the following pen types are available:
Defect: This defines the line drawn around a defect entered by the operator when labels are turned off.
Label: This defines the line drawn around a defect entered by the operator when labels are turned on.
Click the Add button (![]() ) for one of the pen styles.
) for one of the pen styles.

Enter a description for the style.
Configure the fill as required. It'll be displayed in the preview window.
Click OK.
The pen style is added.
You can edit an existing pen style by selecting it from the drop-down list and clicking the Edit button ( ).
).
Reporting
Select Default Tracking Point
Select the Management tab.
Click Settings.
Select the Reporting tab.
Select the default Tracking Point from the drop-down list.
Select Default Defect Indicator
Select the Management tab.
Click Settings.
Select the Reporting tab.
Select the default Defect Indicator from the drop-down list.
Select Month in which Fiscal Year Begins
Select the Management tab.
Click Settings.
Select the Reporting tab.
Select the month from the Fiscal Year Begins in Month drop-down list.