Entering Data
The names of buttons and tabs described here are the defaults but they may have been changed in Form Composer. Due to the high level of customization available it is advised that your system administrator or ATS advisor fully describes how your screen works before you use it.
Before data can be entered you must select which setup you will use. This can be done by clicking Setup in the Main screen.
Log into Inspect VDC and select a setup.
In the Main screen click Input.
The Input screen is displayed for the first subgroup.
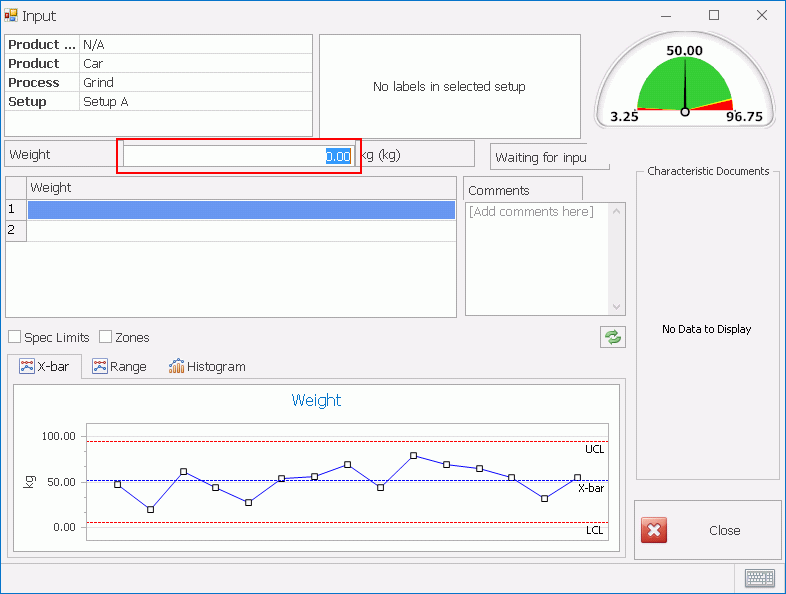
The screenshot below is an example of what the Input screen may look like. However, this may be very different from the one that you are using.

Select the text box highlighted above and enter the required measured value.
Click Return.
The value is stored and the next required value is selected.
If you try and enter a value that is outside the Reasonable Limits for that characteristic the text box will turn red and you will need to re-enter a value within the limits.
You can change the order in which the values are selected while defining the Setup in Cockpit. See here.
Enter the rest of the values.
When you have entered the final value it will ask you if you wish to save the subgroup and move onto the next one.
It is possible to change the way a subgroup is completed. See here.
Click OK.
If any of the values you have entered have caused one of the characteristics to violate the Nelson rules or WECO rules you may be required to fill in information in the Violation screen.
For information on the Violation screen see here.
Continue entering data until the dataset is complete.
Click Close.
Viewing the Charts
As you enter data the values will be added to the chart. Each point on the chart relates to a single subgroup. The chart will always relate to the currently selected characteristic.
Using the checkboxes you can display the Specification Limits and the Zones.
For more information on viewing charts see here.
Entering Comments
You can enter comments to give further information about the current subgroup. This could give reasons why there was an anomalous reading in the current subgroup or it could highlight specific conditions that aren't picked up in the labels.
Using Characteristic Documents
The currently selected characteristic may have documents associated to it. These documents will give further information that will help you to record the value more effectively. The documents could include images displaying how to take a measurement or conversion tables listing how to adjust the number before entering it.
Click on a document in the Characteristic Documents pane to view it.
Limits Gauges
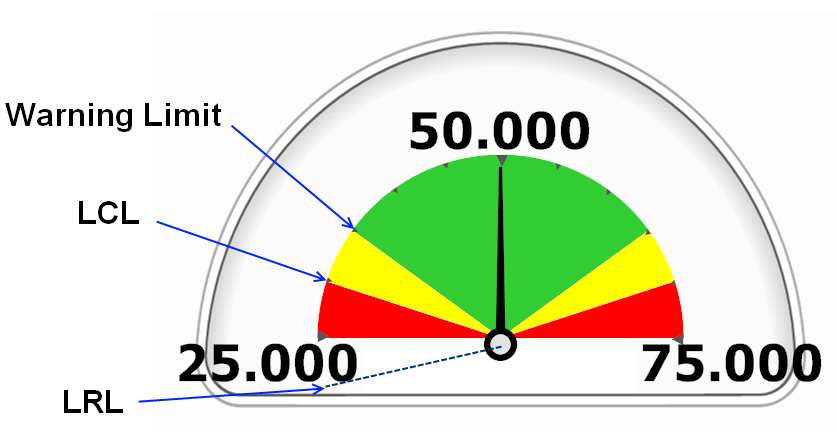
There are two types of indicator that can be used. These indicate whether the number is within control limits or not. The lower limits are shown on the left of the control below. The upper limits are the same on the other side:
If a value is outside the control limits it doesn't necessarily mean the system is out of control. Nelson rules are based upon the average of the values for each characteristic in a subgroup.
Specification Limits Control

Linear Specification Gauge Control

To see what all the current limits are, simply hover the cursor over the gauge and the limits will be displayed.
For a description of the different limits and how they work, see here.