The report display region shows the results of your search organized by column header fields. The title bar of the display region contains the name of the DataSource you are connected to and which search had been performed. In the image below, All DataSources had been used in the Feature Search.
If you would like to have a horizontal scroll bar available in the report display region, Enable Fit Columns must be disabled. The horizontal scroll bar will allow you to expand column headers as desired.
Clicking a header in the report display and dragging it away from the header region until the cursor becomes a black X will remove that column from the display. Using the right-click menu, data can be marked for deletion or set as Keep Selected. To mark multiple points for deletion or keep multiple rows selected, hold down the Ctrl key for individual points or the Shift key to select a range of points. The Keep Selected option will leave the highlighted rows in the grid and remove all others.
Column headers can easily be removed from the column header bar of the report display region. To remove a column, click on the header and drag it until the cursor becomes a black (X). Let go of the mouse button to complete column header removal. Any column headers can be restored using the method described in the Adding Column Headers section above.
DataUtility is capable of sorting the display results by several column headers on multiple levels. This functionality allows for quick and logical ordering of search results in the report display, which can then be easily located and selected for deletion from the database.
Before results can be sorted, a search must be performed.
To use the grouping functionality of DataUtility, select the Enable Grouping radio button in the Grouping/List Options section of the Data Viewing Options window.
When grouping is enabled, a region will appear above the column headers to which you can drag and drop headers from the Columns region of the View Customization pane.
Headers can be used twice while grouping is enabled- once in the grouping tree and once in the main header of the report display region.
Search results can be further sorted by adding column headers to the grouping levels. In the video below, column headers are dragged from the column header bar into the grouping region of the display in order to form dynamic, multi-level sort groups by which data can be organized. Column headers can also be dragged directly from the Columns field of the Field Chooser region of the Data Viewing window.
Each header that is placed in the grouping region of the report display will be designated as a level of grouping, with each subordinate column group added successively in a tree format. As each column header is placed in the grouping region, you will be able to see the display being formatted according to your grouping selections. Any column headers that remain in the main column header bar will be used to sort data within each group.
Once your search results are sorted as desired, entire groups of data can be deleted from the DataSource by selecting the rows and marking them for deletion.
For more information on marking and deleting data, see the topic Deleting Data.
While grouping is enabled, headers can be dragged and dropped into various positions within the column header bar or in the grouping region of the report display. As demonstrated in the video below, column headers located in the Columns field of the Field Chooser region can be clicked, dragged, and dropped into the Column Header bar. This will add the column to the report display and your search results will then be able to be sorted (ascending or descending) by the selected column header.
Grouped column headers can easily be removed from the grouping region of the report display region. To remove a column, click on the header and drag it until the cursor becomes a black (X) as shown in the video above. Let go of the mouse button to complete column header removal. Any column headers can be restored using the method described in the Adding Columns to Groups section above.
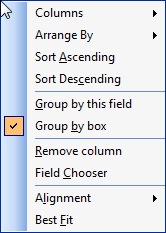
Right-clicking the main column header bar will open another menu containing the various grouping and sort options available within the report display region.
See the topic View Customization.
See the Print section of the Menu Bar topic.