CM4D Web Interface
Page Tabs
There are six pages in CM4D Web that perform different functions in the application.
|
|
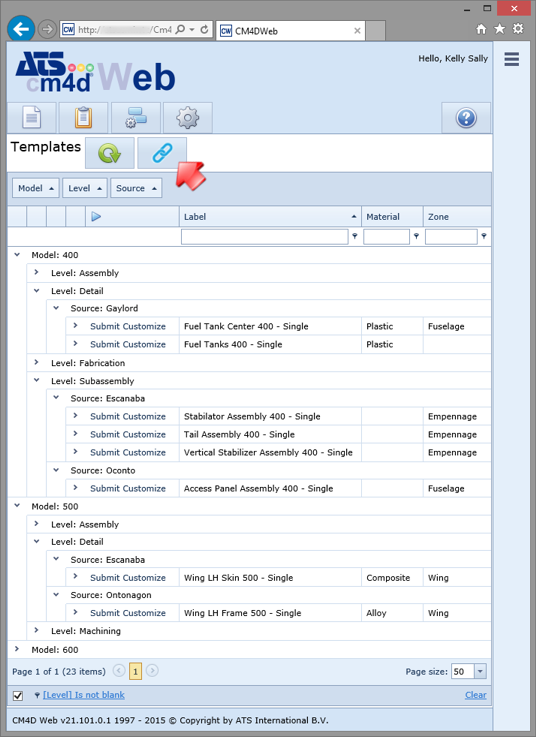
The Templates page contains all of the reports that are available to you for printing. You can either print the report with its default settings, or modify the data that is loaded before printing the report. See the topic, Templates. |

|
|
The Web Reports page contains a list of all reports that you have generated in CM4D Web. Each logged on user can only view and manage their own Web reports. See the topic, Web Reports. |

|
|
The Scheduled Reports page displays all reports that have been generated by CM4D Scheduler. These reports are shared by all users and cannot be modified or deleted in CM4D Web. See the topic, Scheduled Reports. |

|
|
The EventSmith Subscriptions page contains all of the available Events that you can subscribe to in order to receive email notification for specific alarm events or triggers. See the topic, EventSmith Subscriptions. |

|
|
The EventSmith Log lists of all of the events that have been triggered for the Events to which you are subscribed. See the topic, EventSmith Log. |

|
|
The Managed Reports page lists all Managed Reports that can be modified or deleted. New Managed Reports can also be created on the page. See the topic, Managed Reports. |

Buttons
|
|
The Refresh button reloads the contents of the active CM4D Web page.
|

|
|
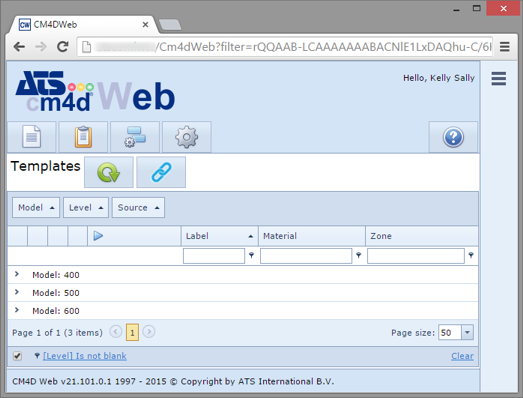
The Share Link button creates a URL link for the grouping and/or filtering you have configured on a page. You can share these links with other users, or you may save your own individual bookmarks for a drilldown structure that allows you to quickly navigate to a specific type of report. Configurations can be saved for each of the four tabs. Report Administrators may choose to develop links for specific groups and/or filters to share with different user groups. Create a Share LinkCreate a Share Link Set up the page with the configuration that you want to save. Click Share Link (
Save as a BookmarkSave as a Bookmark Create a Share Link ( In your web browser, save a bookmark as you would with any web page. Use a Shared LinkUse a Shared Link You may receive a Shared Link from your Report Administrator or another user a few different ways: Link Text - copy the URL and paste it into the address bar of a web browser. Hyperlink - click the hyperlink to open it in your default Web browser. Bookmark - copy the bookmark to your system and add it to your web browser.
|

|
|
The Help button opens the documentation for CM4D Web. |

Site/DataSource
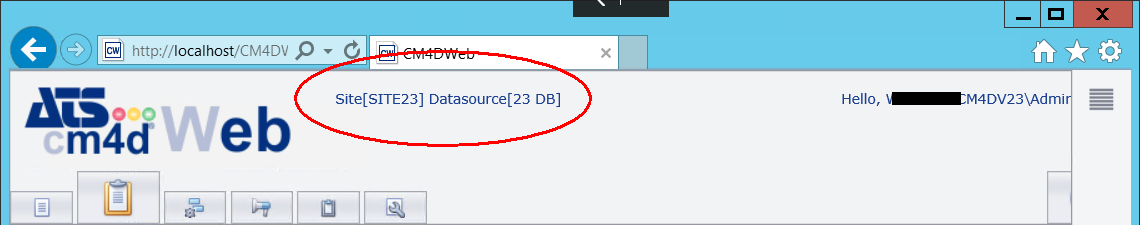
See here for more information.
User Profile Settings
User settings that are saved to the database are accessible via the Hello, User link in the top right corner of the user interface.
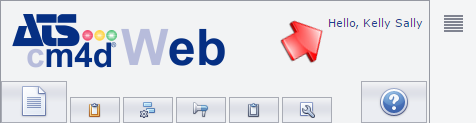
See the topic User Profile Settings for more information.
Customizing the Web Interface
The CM4D Web interface is set up to allow you to customize how the reports are structured, organized, and filtered so that you can see the reports that are important to you, the way that makes the most sense to you.
Some of the configuration of the interface that you customize will be saved for your user login and will be used the next time you open CM4D Web. The columns, grouping, and search results will remain the next time you log in to Web. However, if you turn on the Group Panel and the Search Panel in the Web or Scheduled Reports pages, the panels will only remain open during the current session.
Sort Reports by Column
Change the order that the Reports appear in the list by sorting them by one of the columns. To sort, click the column header once to sort Ascending. Click it again to sort Descending.
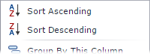
Sort Ascending - orders the rows by the contents of the selected column alphabetically, in ascending order (A-Z).
Sort Descending - orders the rows by the contents of the selected column alphabetically, in descending order (Z-A).
Alternatively, you can select a sorting option by right-clicking on a column header and select an option from the menu.
Group Reports by Column
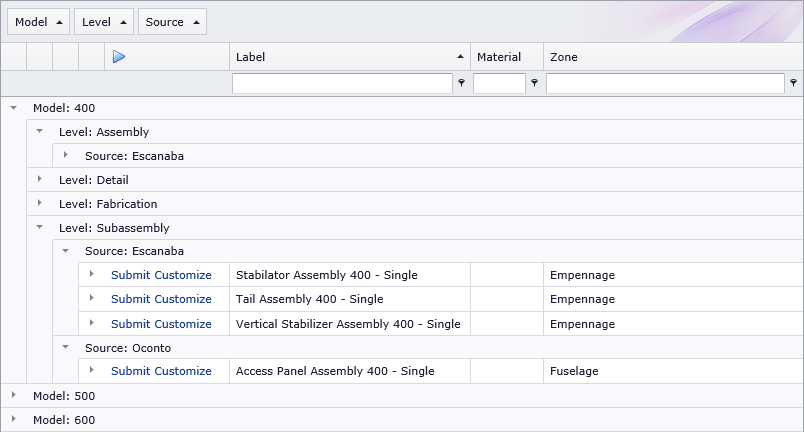
Grouping refers to the organization of column headers. When grouped, the reports will be sorted within a grouped tree structure, allowing you to collapse or expand groups of reports to find the reports that you need quickly and efficiently based on relevant information.

When the Group Panel is enabled, you can drag and drop column headers into the grey region above the column headers. Each header that is placed in the grouping region of the grids will be designated as a level of grouping, with each subordinate column group added successively in order to form dynamic, multi-level sort groups by which data can be organized. As each column header is placed in the grouping region, you will be able to see the grid being formatted according to your grouping selections.
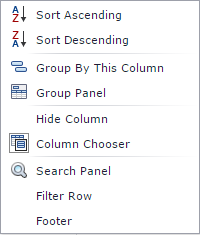
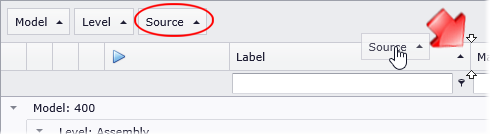
To enable Grouping, right-click on a column header and select Group Panel.
Group by a ColumnGroup by a Column
You can group by a column two ways:
Click and drag a column to the Group Panel:
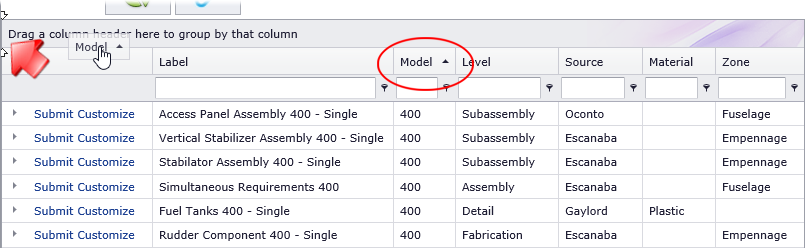
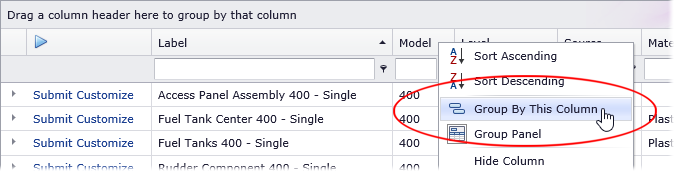
Right-click on a column header and select Group by this Column:
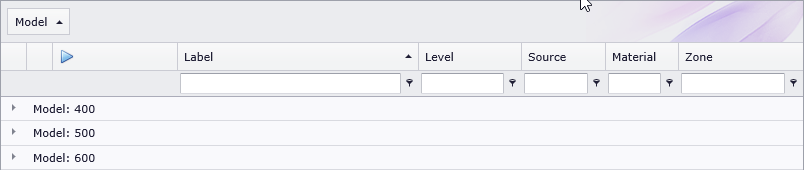
The rows will be grouped according to the values in the selected column.
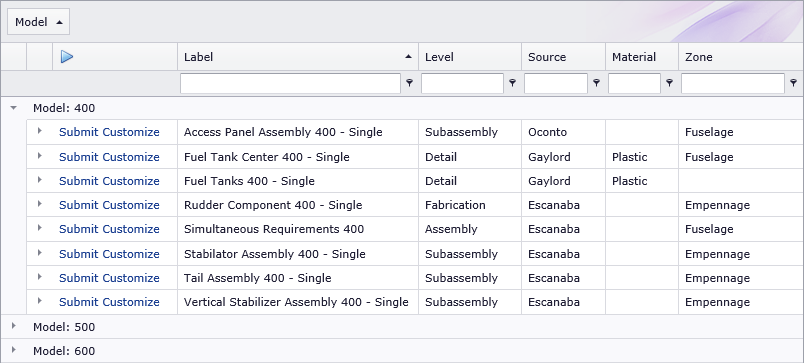
Expand a Group by clicking the arrow ( ) for that row:
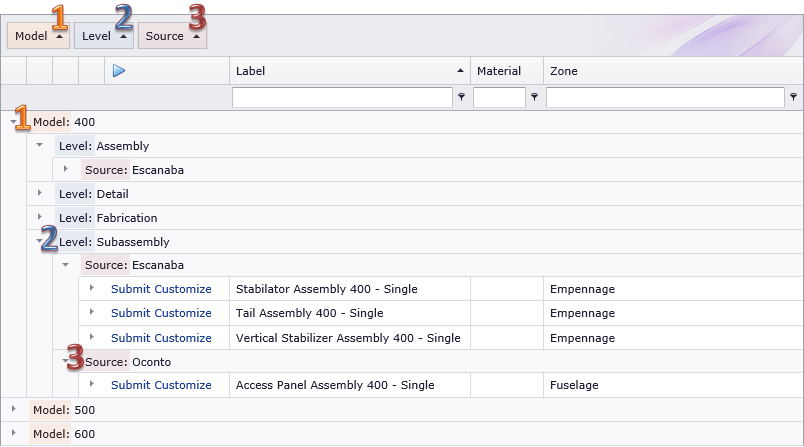
Add additional columns to the Group Panel to build a drill-down tree structure.
To remove a column header from the Grouping area, use one of the following two methods:
Click and drag the header from the grouping area back onto the Column header area.
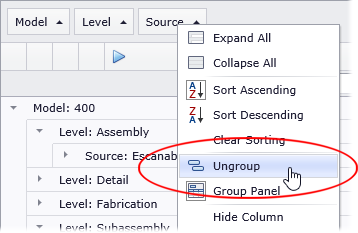
Right-click on the Grouping header and select Ungroup from the menu. When the column header is dropped between two white arrows, it will return to a position within the standard column headers.
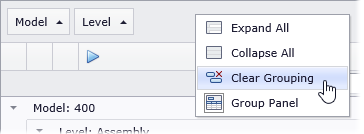
If you have multiple headers that are being used to group, you can remove all of them at once by right-clicking in the Group Panel bar (not on a column header that is grouped) and selecting Clear Grouping from the menu.
Expand/Collapse All GroupsExpand/Collapse All Groups
Right click in the Group Panel and select Expand All to expand all of the groups. Do the same with Collapse All to close all of the Groups down to the root group level.
Columns
The Column Headers are either default fields provided by CM4D Web, are Globally set at the Site level by a CM4D Administrator, or are custom columns programmed in to the reports by the Template Developer. All available columns will depend on your report setup, but all columns can be used to sort, search, group or filter data (other than # and Thumbnail).

Available Columns are an accumulation of all Report Tags defined for all Managed Reports in the database. See the topic Report Tags to learn more.
Enable a ColumnEnable a Column
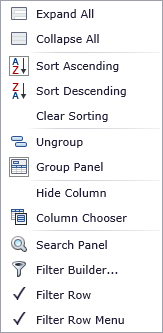
To add additional columns (when more are available), right-click on a column header and select Choose Columns. Click, drag, and drop a column header from the Fields dialog onto either the Column Header area or the Grouping area to restore it in the interface. Two white arrows will appear when you hold the new column over an area where you can add the column. When you find the position you want to insert the column, release the mouse button.
The Column Chooser dialog can be moved around and left open while performing other tasks. Click the X in the Column Chooser dialog to close it.
Sometimes when you open the Column Chooser while the User Activity Log is open, the dialog may end up being hidden behind the log panel.
Search for Reports
You can search the entire list of reports by entering text into the Search Panel edit box.
Enable Search PanelEnable Search Panel
To turn on the Search Panel, right click on any Column header and select Search Panel.
Disable Search PanelDisable Search Panel
To turn off the Search Panel, right click on any Column header and select Search Panel.
Search All ColumnsSearch All Columns
Type text into the Search edit box to filter down the entire grid to only rows containing text matching the string entered. This filtering is dynamic and will update the grid as you type.
Search Within a ColumnSearch Within a Column
To search for something within a specific column, enter text into the Filter Row edit box.
Each column can be searched with different text, but keep in mind that this search is composite, so if you type text into more than one Column a report must match all search strings in order to appear in the list.
Filter Reports
Reports can be filtered by assigning Filters to any of the available Columns. Simple filters can be defined using the Filter Row, or you can use the Filter Builder for more complex filtering.
Filter Row
Type text into the Filter Row edit box to dynamically filter your reports. How the text is applied as a filter can be modified by selecting a different Filter operator from the Filter Row Menu.
Enable Filter RowEnable Filter Row
To turn on the Filter Row edit box, right-click on any Column header and select Filter Row.
Disable Filter RowDisable Filter Row
To turn off the Filter Row edit box, right-click on any Column header and select Filter Row.
Filter Row Menu
The Filter Row Menu allows you to select operators for any text you enter in the Filter Row edit box. The default operator is Contains.
Enable Filter Row MenuEnable Filter Row Menu
To turn on the Filter Row Menu, right-click on any Column header and select Filter Row Menu.
Disable Filter Row MenuDisable Filter Row Menu
To turn off the Filter Row Menu, right-click on any Column header and deselect the Filter Row Menu.
Open Filter Row MenuOpen Filter Row Menu
To open the Filter Row Menu, click the Filter ( )
icon next to the Filter Row edit box.
)
icon next to the Filter Row edit box.
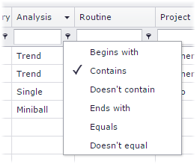
The list of operators in this menu is limited to the basics, but more complex operators are available when you use the Filter Builder. The Filter builder is not available on the Web Reports and Scheduled Reports pages.
Filter Builder
On the Templates and Managed Reports pages, you can create and customize Filters using the Filter Builder.
Open Filter BuilderOpen Filter Builder
The Filter Builder can be accessed by any of the following options:
Right-click on any Column Header and select Filter Builder from the menu.
At the bottom grid area of the page, click Create Filter.
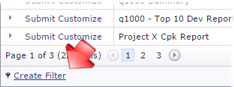
At the bottom of the
page, click on the Filter ()
image.
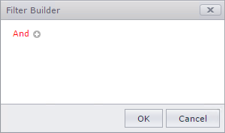
Create a new FilterCreate a new Filter
In
the Filter Builder window, click the plus sign ( )
to add a new Condition.
)
to add a new Condition.
A new default expression will be added.
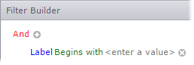
Modify the Condition, Column, Operator and Condition Value.
Click on the red text to select a Condition operator, or to add a new Condition or Group.
Click on the blue text to choose the Column that you want to filter.
Click on the green text to choose the Operator.
Click on the gray text to type in the Value for the condition.
Click OK to apply the new Filter.
The filters created in the Filter Builder will be applied to the columns in the page once you click OK to finish building the filter. The Create Filter link will then be replaced by a Filter Expression Link, which you can click to reopen the Filter Builder and modify the filter.
Filter Condition - select a Boolean operator to define the condition of the filter, or add/remove Conditions or Groups.
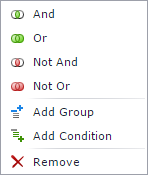 |
Returns reports that match the Filter Condition if and only if all conditions match. |
|
Returns reports that match the Filter Condition if any of the conditions match. |
|
|
Returns reports that do not match the Filter Condition if and only if all conditions do not match. |
|
|
Returns reports that do not match the Filter Condition if any of the conditions do not match. |
|
|
Creates a new Condition nested within the selected Condition.
|
|
|
Creates a new filter expression within the selected group. |
|
|
Deletes the Condition from the Filter. |
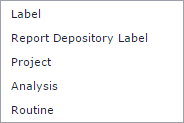
Filter Column - select the operand of the condition. This list is the Columns currently enabled on the page. Other than the default columns Label and Report Depository Label, all additional options are completely dependent on how your reports were developed.
 |
|
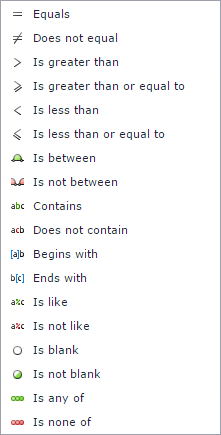
Filter Operator - select an operator to apply to the Column and Condition Value.
 |
|
Filter Condition Value - enter the value for the Condition. Click  and type text. To discard changes to the value and close the active edit boy, press ESC.
Add Condition - click the plus sign () to add a new expression.
Remove Condition - click the x ( ) to delete an expression within a Condition.
Can we improve this topic?