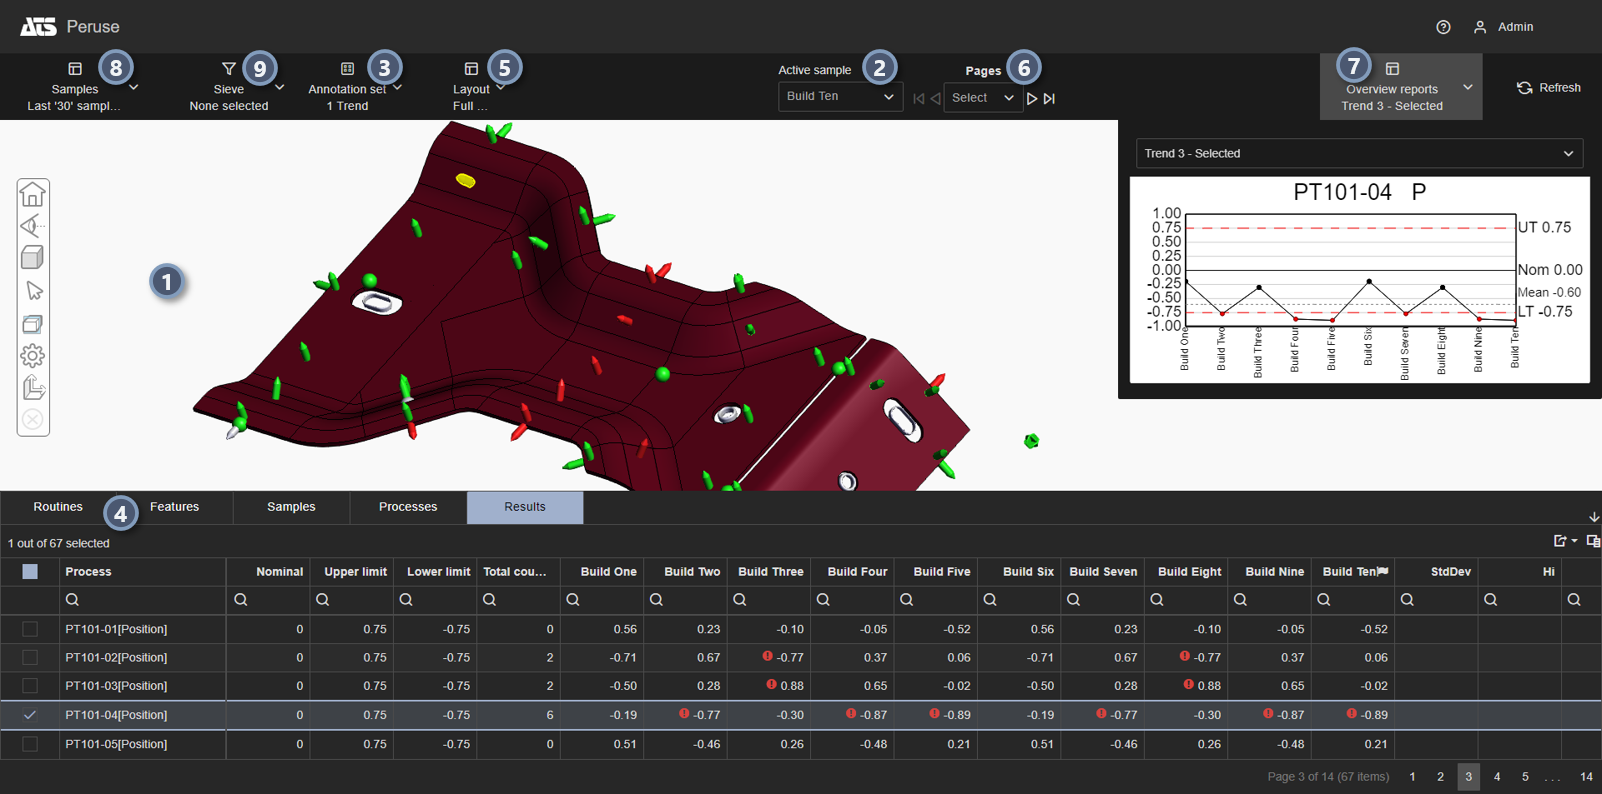
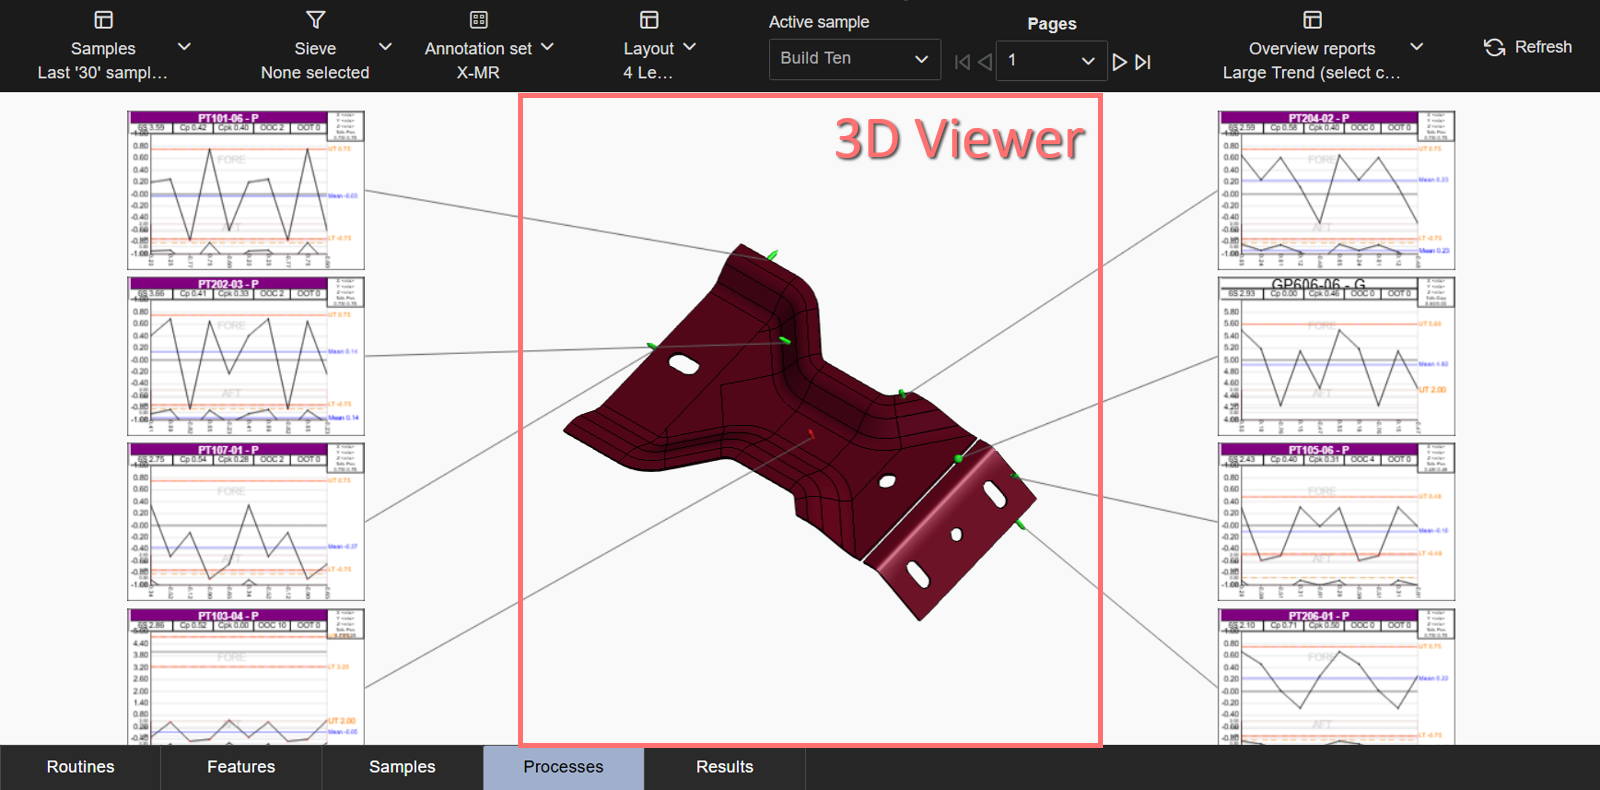
The 3D Viewer page is the area of the user interface containing the 3D model for the loaded data. Once data is selected, whether by clicking a Favorite from the Home page or a result from a Search, the data selected is displayed in the primary page. This page is referred to as the 3D viewer since the main display is the 3D part model. Additional report and grid panels around the outside boundaries of the page can be expanded or collapsed as needed in order to maximize the space for the 3D model.
If your data does not have a 3D model available, the feature markers are displayed in the 3D view as long as you have 3D data for the features.
- Refresh - Reloads the data within the current screen configuration; selected report, open annotations, layouts, etc. stay open and the data is refreshed.
 |
||
| 1. 3D View |
The primary area of the entire user interface. Once data is selected, whether by clicking a Favorite from the Home page or a result from a Search, the data selected is displayed in the primary page. This page is referred to as the 3D viewer since the main display is the 3D part model. If your data does not have a 3D model available, the feature markers will still appear in the 3D view as long as you have 3D data for the features. Additional report and grid panels around the outside boundaries of the page can be expanded or collapsed as needed in order to maximize the space for the 3D model.
The 3D Viewer Tools are used to manipulate the 3D model in the viewer. The tools are located in a vertical toolbar on the left side of the main view area where the 3D model is displayed. The toolbar becomes semi-transparent when it is not actively in use.
|
|
| 2. Active Sample |
The selected Sample which determines what measurement data is used to populate the Summary Report and color-codes the Feature Markers on the 3D Model. There are additional indicators in the Trend Report and the Grids which also indicate the Active Sample. By default, the most recent Sample is set as the initial Active Sample.
|
|
| 3. Annotation Set |
Predefined styles for the chart annotations that are accessed by right-clicking on a feature marker on the 3D model. Each set has styles designed for each Feature type, so depending on the marker selected you may see a different style of chart annotation. The sets are designed to provide optimal displays of information for the Feature selected.
|
|
| 4. Grid Panel |
The collapsible panel along the bottom of the 3D viewer page that is a shared space for the five data grids: Routines, Features, Samples, Processes and Results. Use the grid headers to navigate between grids. Click on a Grid header to go to the specific grid. The active grid is indicated with different color. If the grid panel is currently collapsed, clicking any of the grid headers will expand the grid panel.
|
|
| 5. Layouts | Predefined annotation placement on the screen around the 3D model in the 3D Viewer area. Layouts can vary in number of annotations, where the annotations are drawn and how the annotation are arranged from page to page. The option called 'Fullscreen' is available without any Admin Configuration, and shows only the 3D Viewer without any annotations. | |
| 6. Page Navigation | When a Layout has more annotations than can fit on just one page, the Pages toolbar is enabled for navigation between pages. Select another page by clicking the directional arrow or picking the page number from the dropdown. | |
| 7. Report Panel |
The collapsible panel on the right side of the 3D viewer page where the main reports for your data are located. The dropdown menu contains a list of available reports. Some report types depend on a specific set of data to be selected either from the grid or in the 3D View. The Summary report is displayed by default when data is initially loaded into the viewer page.
|
|
| 8. Sample Panel |
The collapsible panel on the left side of the 3D Viewer page that contains options for loading the actual measurement data for the Routine. This includes several options for choosing which samples are loaded for the current Routine. When collapsed, the Sample panel displays the current sample load method.
|
|
| 9. Sieves | Sieves are predefined filters for selecting the feature types and characteristics to be displayed in the 3D view, grids and reports in CM4D Peruse. Sieve definitions include feature type, characteristics per feature type and characteristic deviation type (absolute or actual values, vector deviation or car deviation). If no sieve is selected, all available processes are loaded. | |
Double-click in view area to zoom max (same as the Fit button).
3D Viewer Feature Markers
Features are chosen directly from the 3D model by selecting Feature Markers. Features selected on the 3D model are highlighted in other areas of the interface, such as the Grids and Reports.
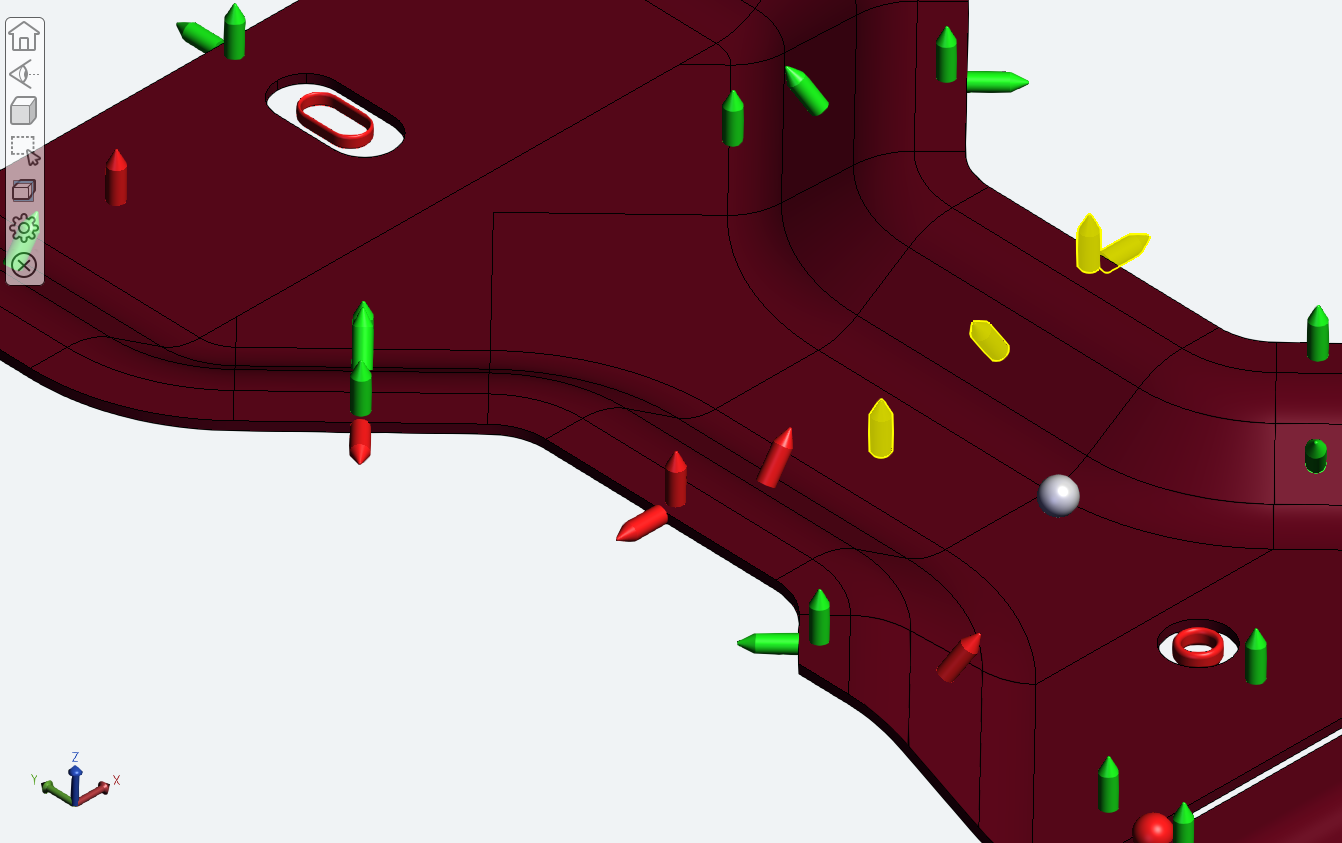
Selected Feature markers are highlighted yellow.
If you cannot easily see the Feature markers for selection, consider changing the Display Mode setting for the 3D model.
Select Individual Features
 |
3D Feature Markers can be selected one at a time by clicking on each marker. To select individual markers:
|
Select Features in an Area
|
3D Feature Markers can be selected by dragging a box around the general area of the markers. To select multiple markers in an area:
While holding Ctrl, any part of the box dragged over selected markers will deselect the markers in the overlapped area. |
3D Viewer Menus and Panels
Along the top of the 3D Viewer area, there are several dropdown menus:
- Active Samples in Peruse - The selected Sample which determines what measurement data is used to populate the Summary Report and color-codes the Feature Markers on the 3D Model. There are additional indicators in the Trend Report and the Grids which also indicate the Active Sample. By default, the most recent Sample is set as the initial Active Sample.
- Annotation Sets in Peruse - Predefined styles for the chart annotations that are accessed by right-clicking on a feature marker on the 3D model. Each set has styles designed for each Feature type, so depending on the marker selected you may see a different style of chart annotation. The sets are designed to provide optimal displays of information for the Feature selected.
- Layouts in Peruse - Predefined annotation placement on the screen around the 3D model in the 3D Viewer area. Layouts can vary in number of annotations, where the annotations are drawn and how the annotation are arranged from page to page. The option called 'Fullscreen' is available without any Admin Configuration, and shows only the 3D Viewer without any annotations.
- - When a Layout has more annotations than can fit on just one page, the Pages toolbar is enabled for navigation between pages. Select another page by clicking the directional arrow or picking the page number from the dropdown.
- Sieves in Peruse - Sieves are predefined filters for selecting the feature types and characteristics to be displayed in the 3D view, grids and reports in CM4D Peruse. Sieve definitions include feature type, characteristics per feature type and characteristic deviation type (absolute or actual values, vector deviation or car deviation). If no sieve is selected, all available processes are loaded.
In addition to the dropdown menus, there are three other screen areas which can be expanded or hidden:
- Grid Panel - The collapsible panel along the bottom of the 3D viewer page that is a shared space for the five data grids: Routines, Features, Samples, Processes and Results. Use the grid headers to navigate between grids. Click on a Grid header to go to the specific grid. The active grid is indicated with different color. If the grid panel is currently collapsed, clicking any of the grid headers will expand the grid panel.
- Report Panel in Peruse - The collapsible panel on the right side of the 3D viewer page where the main reports for your data are located. The dropdown menu contains a list of available reports. Some report types depend on a specific set of data to be selected either from the grid or in the 3D View. The Summary report is displayed by default when data is initially loaded into the viewer page.
- Samples Panel in Peruse - The collapsible panel on the left side of the 3D Viewer page that contains options for loading the actual measurement data for the Routine. This includes several options for choosing which samples are loaded for the current Routine. When collapsed, the Sample panel displays the current sample load method.
3D Viewer Mouse Controls
The mouse controls for the 3D Viewer are dependent on the Selection Mode and which keys/buttons are used.
| Buttons + Keys | Description | ||
| Left Mouse Button | Click+Hold+Move | Rotate the model in 3D space | |
| Double Click | |||
| Right Mouse Button | Click+Hold+Move | Move the model around the viewer without rotation. | |
| Click | Click on a Feature Marker opens the list of available annotation. | ||
| Mouse Wheel | Zoom model in or out; center of zoom area is focused on cursor placement. | ||
| Scroll Forward | Zoom in on the model. | ||
| Scroll Back | Zoom out on the model. | ||
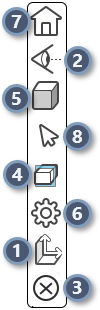
3D Viewer Tools
The 3D Viewer Tools are used to manipulate the 3D model in the viewer. The tools are located in a vertical toolbar on the left side of the main view area where the 3D model is displayed. The toolbar becomes semi-transparent when it is not actively in use.
|
|
Modify the size of the annotation open within the 3D viewer. This may be used if the initial annotation size is not ideal for the zoom level you prefer for the model.
Preset camera options to quickly move the model to a preset orientation.
Closes all open annotation attached to the Feature markers in the 3D View. This button is disabled until at least one annotation is open.
The Cutting Plane tools allow you to add or remove cutting planes on the 3D model. To open the fly-out menu, click the fifth icon from the top of the viewer toolbar.
The Display Mode toolbar has options for changing the rendering of the 3D Model to one of four predefined modes. A flyout menu contains the four options; the icon for the current mode is shown in the toolbar.
The Feature Marker Settings include options for Feature marker modes and resolutions. These options may effect the load-time performance for Feature markers.
The Fit button resets the model so it is zoomed (in or out) to the extent it fits within the viewer area (aka, zoom max). For Exchange files, this activates the default view.
The Selection tools are used to select feature markers on the 3D model. Choose a selection tool to change the cursor between single click and area select.
|
See the topic Peruse 3D Viewer Tools for more details.
3D View Edit Mode
When using any Layout other than Full screen, the 3D Viewer remains dormant until you manually put the viewer into edit mode. This mode activates the 3D model controls, 3D Viewer Toolbar and feature marker interactions.
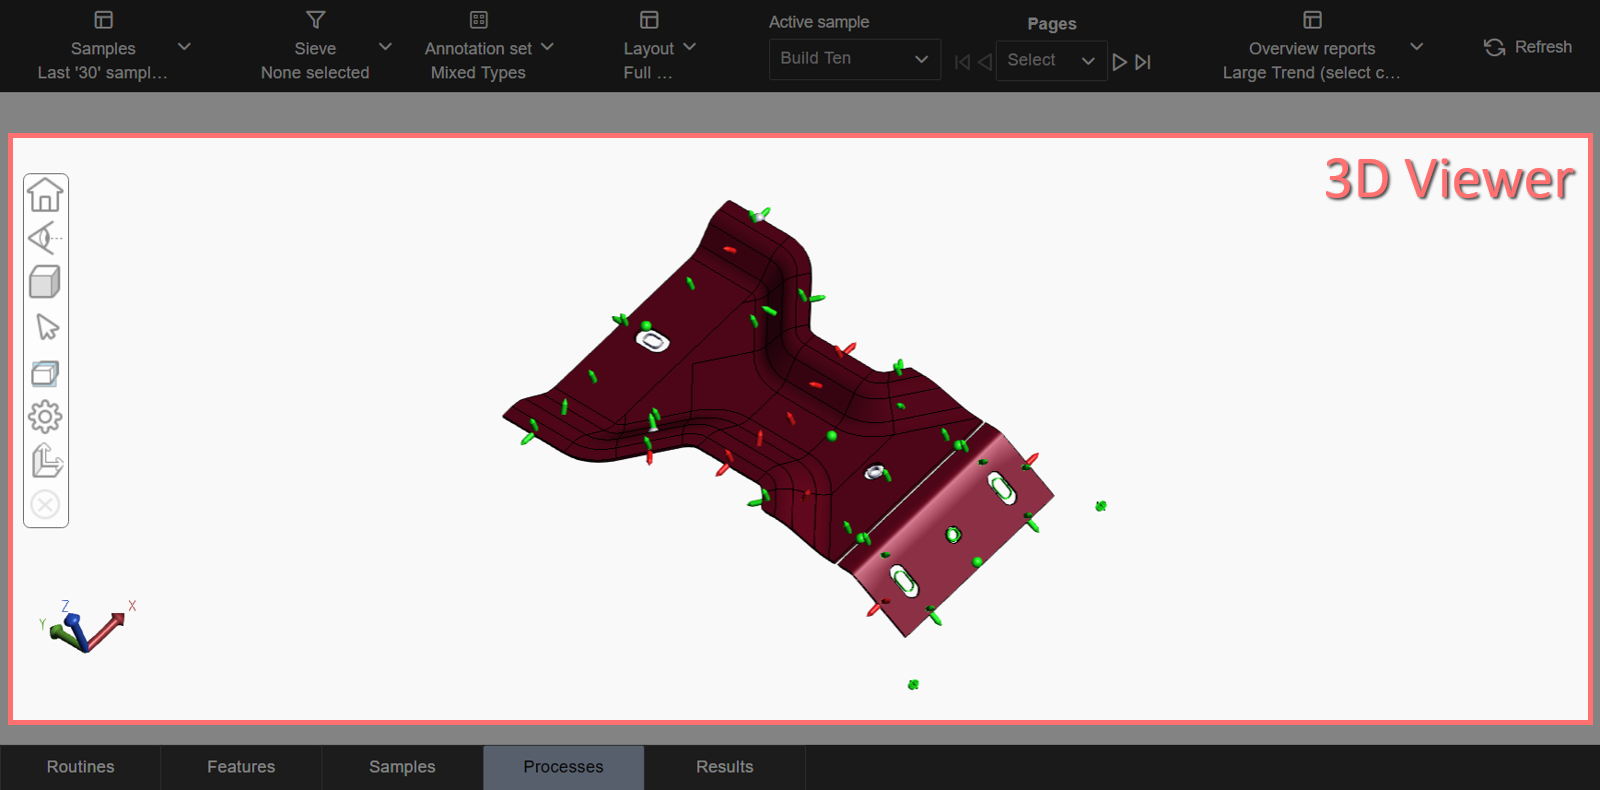
3D Viewer area of the Fullscreen Layout
3D Viewer area of a custom Layout
To activate edit mode, double-click any part of the page that contains the viewer area. Once activated, the 3D viewer toolbar is enabled and normal interaction with the model and feature markers is restored.
Any rotation or zooming of the 3D model may not be retained upon exiting HOOPS viewer mode. Some layouts may have additional properties configured that can apply automatic adjustments to the rotation or zoom of the model.
Click outside the 3D viewer area to exit edit mode.
Selecting a row of data in the Feature grid also selects the Feature Marker on the 3D model, and choosing a Process or Result in the grid shows the data the Report panel.
Selecting data in one area of the page synchronizes with other areas.