v20.4.0
CM4D Classic
"Shading" Style for Limit Lines
Styles for Chart or Graph plot space lines have been enhanced to allow you to alter the appearance of the space between limit lines. This new style can help you to identify the Spec Limits of the chart at a glance. Instead of only having lines to indicate spec limits, you can now apply a brush style that fills the space between the lines (or, in the case of unilateral spec limits, from the line to the edge of the plot space).
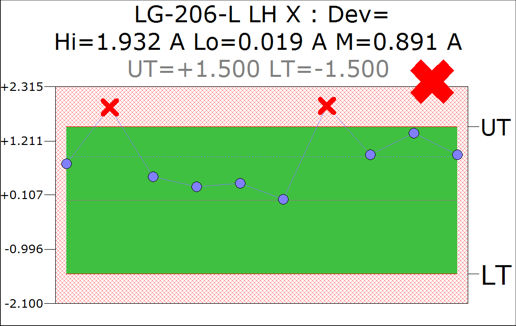
In the example below, a Trend Chart has been configured to appear green in between the Upper and Lower Spec Limit (or Tolerance) lines. This is achieved by assigning a Brush color to the Spec Limit lines in the Main Plot Space properties. You can also apply a Hatch pattern to the brush color to achieve a sort of “transparent” color (in the image below, the area outside the Tolerance area is Red Hatch – Diagonal Cross).
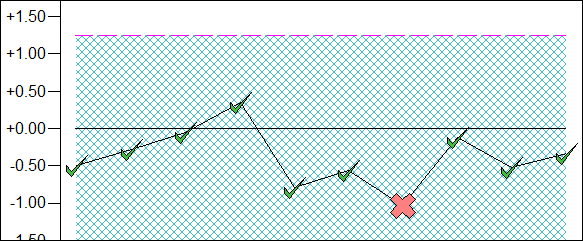
Another use of the Brush property with Limit Lines is to easily display both Spec Limit and Spec Limit 2. If you used two marker types for the two spec limits, one may cover the other if the same point meets both specification limts. However, now you could set up Spec Limit to be identified using a Marker, with Spec Limit 2 set to be identified by the shading. In the image below, Spec Limit (a Bilateral Tolerance) is the red x, while Spec Limit 2 (a Unilateral Tolerance) is indicated by the light teal hatching in the background. Using these properties, you can easily see where your data falls for both Spec Limits.
The Brush style can be applied to any of the Limit Lines, as well as User-Defined Lines. For User-Defined lines, the brush will only be applied when there are exactly two (2) User-Defined lines. If there are more or less than 2 lines, the Brush property will not be applied.
Benchmark Graph Performance
The performance of Chart and Graph annotation in CM4D has been improved. The most noticeable performance increase is with Benchmark graphs. In addition to the general performance improvement, Benchmark graphs can use a new Resolve option for Scores that can potentially decrease the time it takes to resolve your data.
The enhancement has been made to the way variables are resolved in the Scores that are used with Benchmark graphs. A new option has been added to the Score Bin properties that will assume that the bin boundary variable would resolve the same information for every cell in the DataSet row, so it does not need to resolve every cell in that row. If the Score Resolve is enabled, the variable is only resolved for the first cell in the row, thereby saving time when displaying Benchmark graphs in a report.
However, you must decide when or if this should be used. The following four scenarios may help you to understand when the Score Resolve option with a Benchmark could be used.
| Scenario | Data Setup | Result |
|
1. Example Score – Cpk |
|
Score Resolve option will not have any effect on resolve times. Scores using integers typically resolve faster than variables anyway, since all cells in the row already use the same boundary value. |
|
2. Example Score – TolEval |
|
Score Resolve option may be used, and may result in a significant improvement for resolve times. |
|
3. Data Changes from Cell to Cell |
|
Score Resolve option should not be used. |
|
4. Tolerance Changes from Cell to Cell |
|
Score Resolve option may be used, and may result in a significant improvement for resolve times. Since Benchmarks only calculate on the current Process, the Tolerance will not change within the row being calculated. |
The Score Resolve option is not enabled by default, so any current Benchmark graphs will only be partially enhanced by the overall performance improvements. If you want to use the new Resolve option, you will need to edit any existing Scores used for Benchmarks that are suitable for this method of Resolve. Remember that you can use the Export/Import Scores option to copy updated Scores between documents.
The Score Resolve option only applies to Benchmark graphs that use a DataSet as a DataSource. It does not apply to DataStacks with the Benchmark Evaluation type. If a Score with Resolve enabled is used with any annot other than Benchmarks, the Score Resolve option will not be applied.
How can you tell if there were improvements to your Benchmark graphs?
Try the following:
Compare the same document using Benchmarks in both your current version and in v20.4.0.
In v20.4.0, compare the resolve time of your Benchmarks using the Score with or without the Score Resolve option enabled.
Keep in mind that when you first open a document, the DataSources will take time to resolve initially. Once the DataSources have been resolved once, the DataSources used by the DataSets should already be resolved, and you can compare the second resolve for the actual resolve time for the Benchmark graphs.
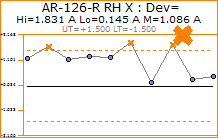
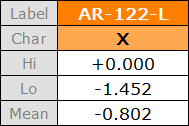
New CM4D Color: Orange
The colors Orange and Light Orange are now available in CM4D Classic for Annotation Styles.
 |
 |
v20.3.0
CM4D Classic
Internal Scripting
Internal Scripting capabilities have been added that allows you to write scripts using the Visual Basic or C# programming languages to create functions and procedures to automate things such as creating DataSets, modifying templates, and loading data. In addition to general program functionality, access to the CM4D API is available.
CM4D has no control over what can be done with a script, so it is possible that you could end up writing scripts that lock up, crash, or otherwise disable CM4D. ATS maintains no responsibility for any scripts that you write so exercise caution and be aware of what is being done with your scripts.
See the topic, Scripting.
Managed Document Selector
The default behavior of the Managed Document Selector (added in v20.0) has been modified. When the Managed Document Selector is opened, the Site tab will be activated. If the Site tab is not configured in the settings, then the first tab will be displayed. The default site for the current user will be selected by default.
Verify Document Exists
A “Verify Document Exists” button has been added to the Managed Document Selector, which confirms that CM4D can find the selected document in the saved directory. This saves on time, as you will not need to attempt to load a document over a network before finding out that it no longer exists.
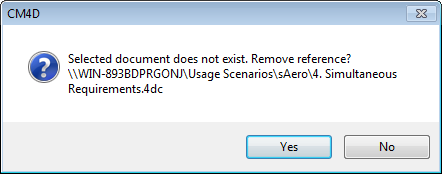
If the managed document no longer exists, you are given the option to remove that document reference from the Site database.
v20.2.4
CM4D Classic
A fix made to tables in v20.2 changed how Table annotation using variables resolved when subsets of DataSet rows are used as the DataSource. This new way of displaying tables is actually the correct way, but some existing users have a large number of documents that rely on the way tables have been resolving until now. Rather than forcing users to change potentially hundreds of documents, we have instead provided a way to retain the behavior of tables from the past versions.
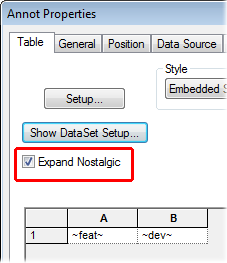
To support the migration of existing tables, we have added a new option to the Table annot properties called Expand Nostalgic. What this means is that tables with the Expand Nostalgic property turned on will expand in the same way as seen in previous versions.
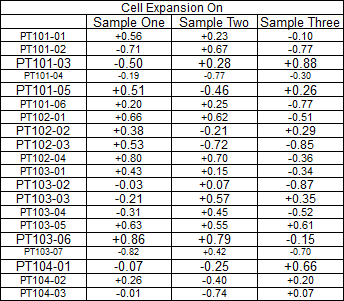
For example, a table set up to load rows 1 through 5 from the DataSet and did not use Expansion of Features and/or Samples (at the Cell Property level) would produce something like the following:
|
|
v20.2.3 (and earlier) |
v20.2.4 |
|
Table Resolved |
|
|
|
Table Setup |
|
|
Another example is of a table that uses the same DataSource as the first example, but the way the variables are inserted into the cells may display information in way that appears correct:
|
|
v20.2.3 (and earlier) |
v20.2.4 |
|
Table Resolved |
|
|
|
Table Setup |
|
|
By default, Expand Nostalgic will be turned on for any existing table annotation in documents created prior to this version. Any new tables will have this option turned off by default, but can be turned on if you want tables to behave the same way they did in an earlier version.
To enable this option, you would go to the Table Properties and select the check box called “Expand Nostalgic”.
Tables that have Expand Features and/or Samples turned on (in the Cell Properties), or tables that Use All Rows from the DataSet, will not appear any differently than in previous versions. They will appear the same whether the new Expand Nostalgic is turned on or not.
|
|
Tables (Expand Nostalgic On or Off) in v20.2.4 |
|
Use All Rows or Rows 1-5 & Expand Features and/or Samples OFF |
|
|
Use All Rows & Expand Features and/or Samples ON |
|
|
Use Rows 1-5 & Expand Features and/or Samples ON |
|
v20.2.0
Classic
Allow Tables to Span Multiple Sheets
For Table annotation, the number of Columns can now be set, as previously only the number of Rows could be selected. When working with tables that contain a large number of columns, by selecting which columns appear on a sheet, you can create a table of information that spans multiple sheets.
Sheet 1 could display columns 1 through 10, Sheet 2 could display columns 11 through 20, and so on.
To select the number of columns in a table:
Right-click on a table annotation and select Properties.
Go to the DataSource tab.
In the Samples section, select the check box Use Only Sample #.
Set the Sample # fields to the column numbers you want to include in the table.
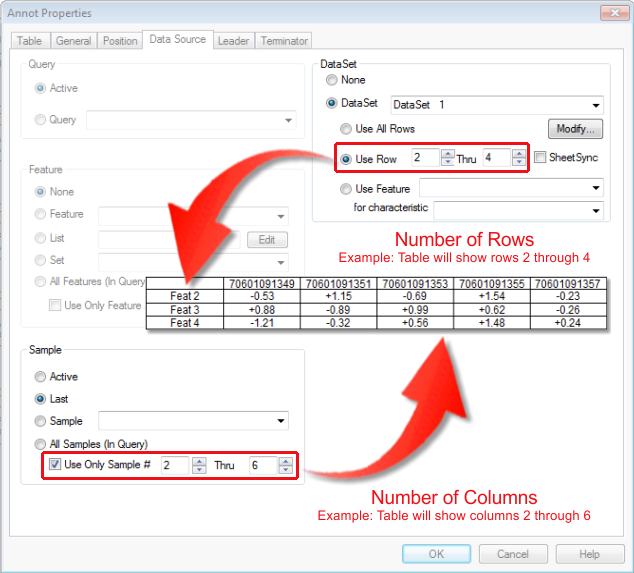
To load a set number of Last Samples, enter negative numbers in the Sample # fields.
‘-1’ means the last Sample, so setting this property to ’Use Only Sample # -5 Thru -1’ would mean the last five Samples would be loaded in the five table columns.
Allow Annot off the Sheet
A new Document Default option has been added which allows annotation to be placed off of the sheet (on the green area). When this option is off, any annotation moved off of the sheet snap back to the nearest sheet margin.
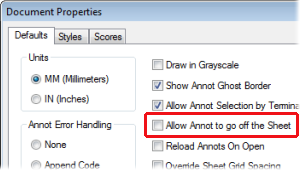
This option, which is off by default to support backwards compatibility, can also be set in the [defaults] section of the Cm4d.ini file: allow_annot_off_sheet=0
Sift Rule Variables
A new variable, ~siftrule~, has been added that reports various summary statistics on data in a DataSet that is associated with a particular Sift Rule.
New variables available:
|
~siftrule,[ ],boxhi~ |
~siftrule,[ ],q1~ |
~siftrule,[ ],range~ |
|
~siftrule,[ ],boxlo~ |
~siftrule,[ ],q3~ |
~siftrule,[ ],rowcount~ |
|
~siftrule,[ ],hi~ |
~siftrule,[ ],mean~ |
~siftrule,[ ],sum~ |
|
~siftrule,[ ],lo~ |
~siftrule,[ ],median~ |
~siftrule,[ ],totalcount~ |
|
~siftrule,[ ],iqr~ |
~siftrule,[ ],nospeccount~ |
~siftrule,[ ],conformcount~ |
|
~siftrule,[ ],invalidcount~ |
~siftrule,[ ],nospeccount2~ |
~siftrule,[ ],nonconformcount~ |
|
~siftrule,[ ],lif~ |
~siftrule,[ ],outofspeccount~ |
~siftrule,[ ],percentconform~ |
|
~siftrule,[ ],uif~ |
~siftrule,[ ],outofspeccount2~ |
~siftrule,[ ],percentnonconform~ |
|
~siftrule,[ ],lof~ |
~siftrule,[ ],percentinvalid~ |
|
|
~siftrule,[ ],uof~ |
~siftrule,[ ],percentvalid~ |
|
When a Sift Rule variable is used with two parameters, the calculation is done only for the Sift Rule that is specified by the first parameter. The second parameter is the statistic that will be calculated on the data included in the Sift Rule specified by the first parameter.
The first parameter can be specified using one of the following options:
-
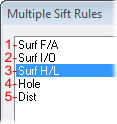
Number of Sift Rule - the integer that indicates the position of Sift Rule in the list, as it appears in the Multiple Sift Rules dialog.
-
Label of Sift Rule - label of Sift Rule.
|
|
Example using Number: ~siftrule,3,mean~ |
|
Example using Label: ~siftrule,Surf H/L,mean~ |
DataStack Evaluation - SiftRule Variable
A new DataStack type has been added: Evaluation/SiftRule Variable. This evaluation will process the defined variable string against all SiftRules within the stacked DataSets. When the ~siftrule~ variable is used with this DataStack type, the first parameter is not used.
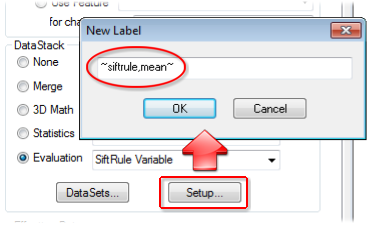
The resulting DataStack has a row for each DataSet in the stack. The label of the row is the label of the DataSet. There will be one column for each SiftRule. If more than one DataSet is stacked, then the number of columns will be determined by the DataSet with the most SiftRules defined. The label of the column is set to the label of the SiftRule.
Example Table for a DataStack with Evaluation/SiftRule Variable ~siftrule,mean~.

If more than one DataSet is stacked, the column labels will only appear if all of the Sift Rules in that column have the same Sift Rule label. If the Sift Rule labels are different, the column header will remain empty.

Interactive
Multiple Sift Rules for Sticky Reports
Support for saving Multiple Sift Rule settings has been added to Sticky Reports.
v20.1.1
Annot DataSource Fix
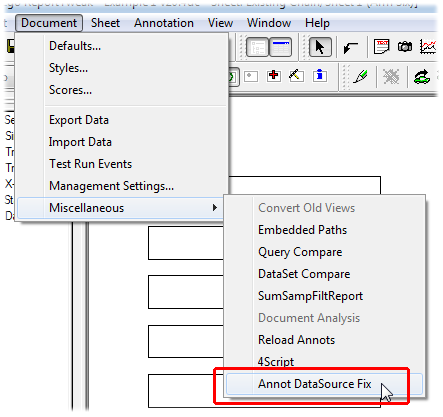
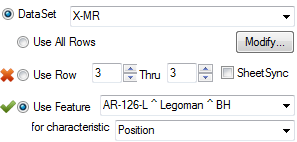
Functionality that previously existed in the Report Tweak Analysis dialog is now moved to its own dialog, called Annot DataSource Fix. Using this dialog, alternate features are found based on two search parameters:
-
Routine label – the Feature has the same label, but is in a different Routine
-
Feature labels - the Feature is set to use a label that begins or ends with 'L' or 'R', and a new Feature has a label that begins or ends with the other. For example, if the current Feature label begins with an 'L', then we will look for a new Feature that has a label that begins with an 'R'.
This functionality is particularly useful when it is paired with the Mirror Annot operation to make building reports for Left and Right handed parts easier. In a report that is set up to use Left Handed features, you can use the Annot DataSource Fix dialog to replace all Left features with the corresponding Right Handed features.

To access this dialog:
-
Select Document > Miscellaneous > Annot DataSource Fix.

-
Click the Fix button.
-
The Set Features are replaced by the Alternate Features:

-
Click Close to return to the report.
-
Note the previously empty annotation are now populated with the corresponding Right Hand features.

The Annot DataSource Fix option is only available for annotation that have a DataSource that selects the Feature by label, not Row number. To change the annotation from Row number to Feature, click the Convert button.
DataStack Evaluation – Summarize by Sample Filter
A new Evaluation type has been added to DataStacks: Summarize by Sample Filter. This evaluation summarizes stacked data based on the Sample Filters used. The Setup for this evaluation includes one or more Sample Filters (A-Z), one Feature Filter (optional), event triggers, values based on tolerance, and sorting.
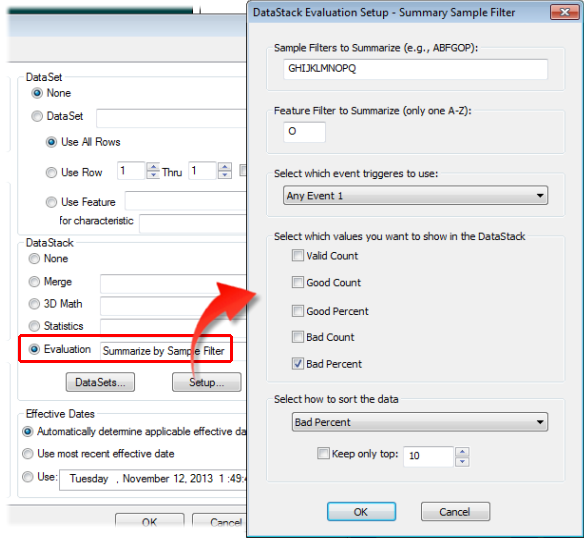
The Feature Filter is optional. If a Feature Filter is not specified, then all 'columns', or Sample Filters, are accumulated.
Summary Sample Filter Report
A new report building tool has been added to CM4D to be used in conjunction with the Summary of Sample Filters DataStack Evaluation. This report will display a summary analysis of a part as it relates to the Sample filters assigned. Sample Filters will be laid out across the sheet in columns, with each Sample Filter value being a row in that column.
If a Feature Filter is designated in the DataStack Evaluation setup, then only samples that use that Feature filter will used in the summary report. If no Feature filter is indicated, then all samples will be used in the report.
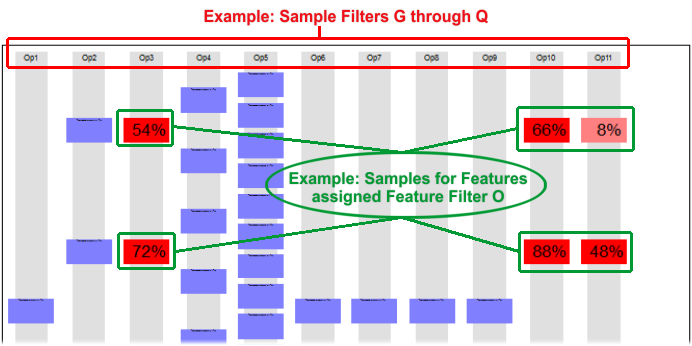
One use case for this type of report may be of a manufactured part that progresses through a number of tasks, where each task may be performed by any one of a number of machines. If each task is assigned a Sample Filter, and each machine is designated as a value for that Sample filter, then CM4D can use that data to track the progress of the part through the system. The Summary Sample Filter Report provides information about each machine in the process, giving you a percentage of parts made by that machine that are within tolerance specifications.
To build a Sample Filter Summary report:
Create one annotation, which will be used as the template for creating all the other annotation needed to create the report.
Assign a DataSource to the annotation that uses the new evaluation type Summarize by Sample Filter.
Place it so that there is enough space above and below, as well as to the right, to accommodate all of the resulting annotation. Don’t worry if you don’t know how big your report will be, you can always re-run the report using any one of the annotation.
Select the annotation.
From the Document menu, select Miscellaneous > SumSampFiltReport.
When the 'Done' message appears, click OK.
v20.1.0
Sticky Reports
A new mechanism has been added to CM4D Interactive that allows you to make small adjustments to your standard reports and save the modified arrangement for recall in a future session of CM4Di. These saved custom reports are called Sticky Reports.
Similar to modifying templates in CM4D Classic, Sticky Reports greatly increase the flexibility of the CM4Di’s dynamic reporting. Using Sticky Reports you can select different chart types, modify report layouts, change view orientations, and save how the data is loaded.
A Sticky Report may be saved for all users, a single user, or a specific group of users.
v20.0.0
ATS Licensing
ATS CM4D and ATS CM4D Reporter are now licensed by the ATS Licensing Service. ATS CM4D requires version 2.0 of the ATS Licensing Server.
E-Mail Reports
Functionality has been added to print the current report to a PDF and attach is to an e-mail. As with standard CM4D printing, whatever is in your main display region will be printed (view the Array Sheet to print entire report).
E-mail Sheet may be accessed either from the Print menu, or using the e-mail ( ) button.
An e-mail client must be installed on the machine that CM4D is running on in order for the e-mail sheet option to work.
E-mail Sheet is also available in CM4D Interactive and CM4D Workcell.
This functionality uses a built-in PDF writer. However, this is not used for printing reports via CM4D Scheduler or WTC, so you will still need an alternative PDF writer (such as eDoc PDF Printer) to print your reports.
Adjustable Array Sheet
Functionality has been added that allows you to temporarily modify the appearance and arrangement of sheets within the Array Sheet. This may be particularly useful when organizing data throughout a SheetSet with a large number of Sheets.
To use this functionality, toggle ReportTweak mode and begin altering the Array Sheet:
Hide/Show Sheets - Sheets can be hidden while working with the Altered Array Sheet. Hidden sheets will be indicated by glyphs in the sheet margins. The Hide/Show options can also be accessed by right-clicking on a Sheet label in the Sheets Tree.
Move Sheets - Drag a sheet and drop a sheet into a new position within the Array sheet. An indicator cursor will show where the sheet will be moved.
When changes have been made to the Array Sheet, the desktop background in the Display area of CM4D will turn red. Once ReportTweak mode is turned off, any alterations to the appearance of the SheetSet will revert to the last saved state, and the desktop will turn back to green.
If you print your report while viewing an altered Array Sheet, the report will be printed in its original state.
Feature Marker Text
3D Views have been enhanced to display text with the existing feature markers that identify the feature while the View is in Edit Mode. The Marker Text will rotate and scale with the view. Feature Marker text can be enabled or disabled. To set the properties of the Feature Marker text, use the View Annotation Properties dialog.
Feature Marker Text can use variables to resolve the following Feature information:
Feature Label - ~label~/~feat~/~feature,label~
Feature Description - ~feat,desc~
Feature Alias - ~feat,alias~
Feature Sequence - ~feat,seq~
Feature Marker Text will also be displayed in CM4D Interactive, when a View is in Edit Mode, provided Marker Text for that view is enabled in the CM4Di Startup Template.
Find Features
New functionality has been added to CM4D Interactive to allow you to find features from multiple Routines without loading any Routines from the Database. To access this dialog, right-click anywhere within the yellow Nav tree and select “Find Features” from the context menu.
Features from multiple Routines can only be loaded into the report if they are from the same DataSource.
Mirror Annot
An option has been added to the ReportTweak functionality that allows you to mirror the selected view and all annotation that are connected via leader lines.
Managed Document Selector
An interface has been added to allow for advanced drilldown and filtering of Managed Documents. Managed Documents may be searched for and sorted by Site, DataSource, Label, Filters, and more.
The first time you select Open Managed Document, you will be prompted to configure the Document Selector. The configuration settings (File > Document Selection Settings) may be saved as Public, for a particular Group, or for the current User.
See the topic, Managed Document Selector.
Managed Document API
API functions have been added to provide access to Managed Document properties.
-
QaSiteConfiguration – ID, Code, Label, UNC Path, etc.
-
QaManagedDocument – Filename, Name, SiteID, etc.
-
QaEventChoice – ID, ManagedDocumentID, etc.
-
QaReportChoice – ID, ManagedDocumentID, SheetLabel, Report Label, etc.
-
QaManagedRoutine – RoutineID, DataSourceID, RoutineLabel, etc.
-
Plus some new QaDoc extensions
Since Managed Documents and CM4D Documents can be shared it is highly recommended that modifying existing “live” documents be limited to times when general users are not using the system. Also, Document Manager Privilege is required to modify Managed Documents. Site Manager Privilege is required to modify Site Configurations.
Images API
API functions have been added to provide access to 3D views, Document and Routine images.
-
QaImages is a list object that provides access to a Document or Routine image list.
-
QaImage is an object that represents a single Document or Routine 3D view image. All properties can be retrieved and set except for the Label property.
-
Plus some new QaDoc, QaDbDataSource, and QaRoutine methods
Sticky Reports
Sticky Reports allow you to define an arrangement of Annotation and preserve it for recall in a future session of CM4D Interactive. This functionality is similar to saving a Template in CM4D Classic.
